Here is presented my mobility digital traces over the last year.
First, I wanted to extract a power law of activities durations, where the top left chart represents activities in term of duration.
In terms of space, I wanted to represent the total destinations that I visited across the year, where there three clusters, which are linked in a spation temporal scale. From the main cluster, that’s where my daily activity occurs, therefore, urban traces come to live, showing up my personal city, where I work, live, etc.
In the temporal side the daily gyration radius [1] was calculated, in order to have sense of daily activities throughout the year. Burst of activity can be appreciated, which exceed my average daily mobility and can be linked to certain periods of times over the year.
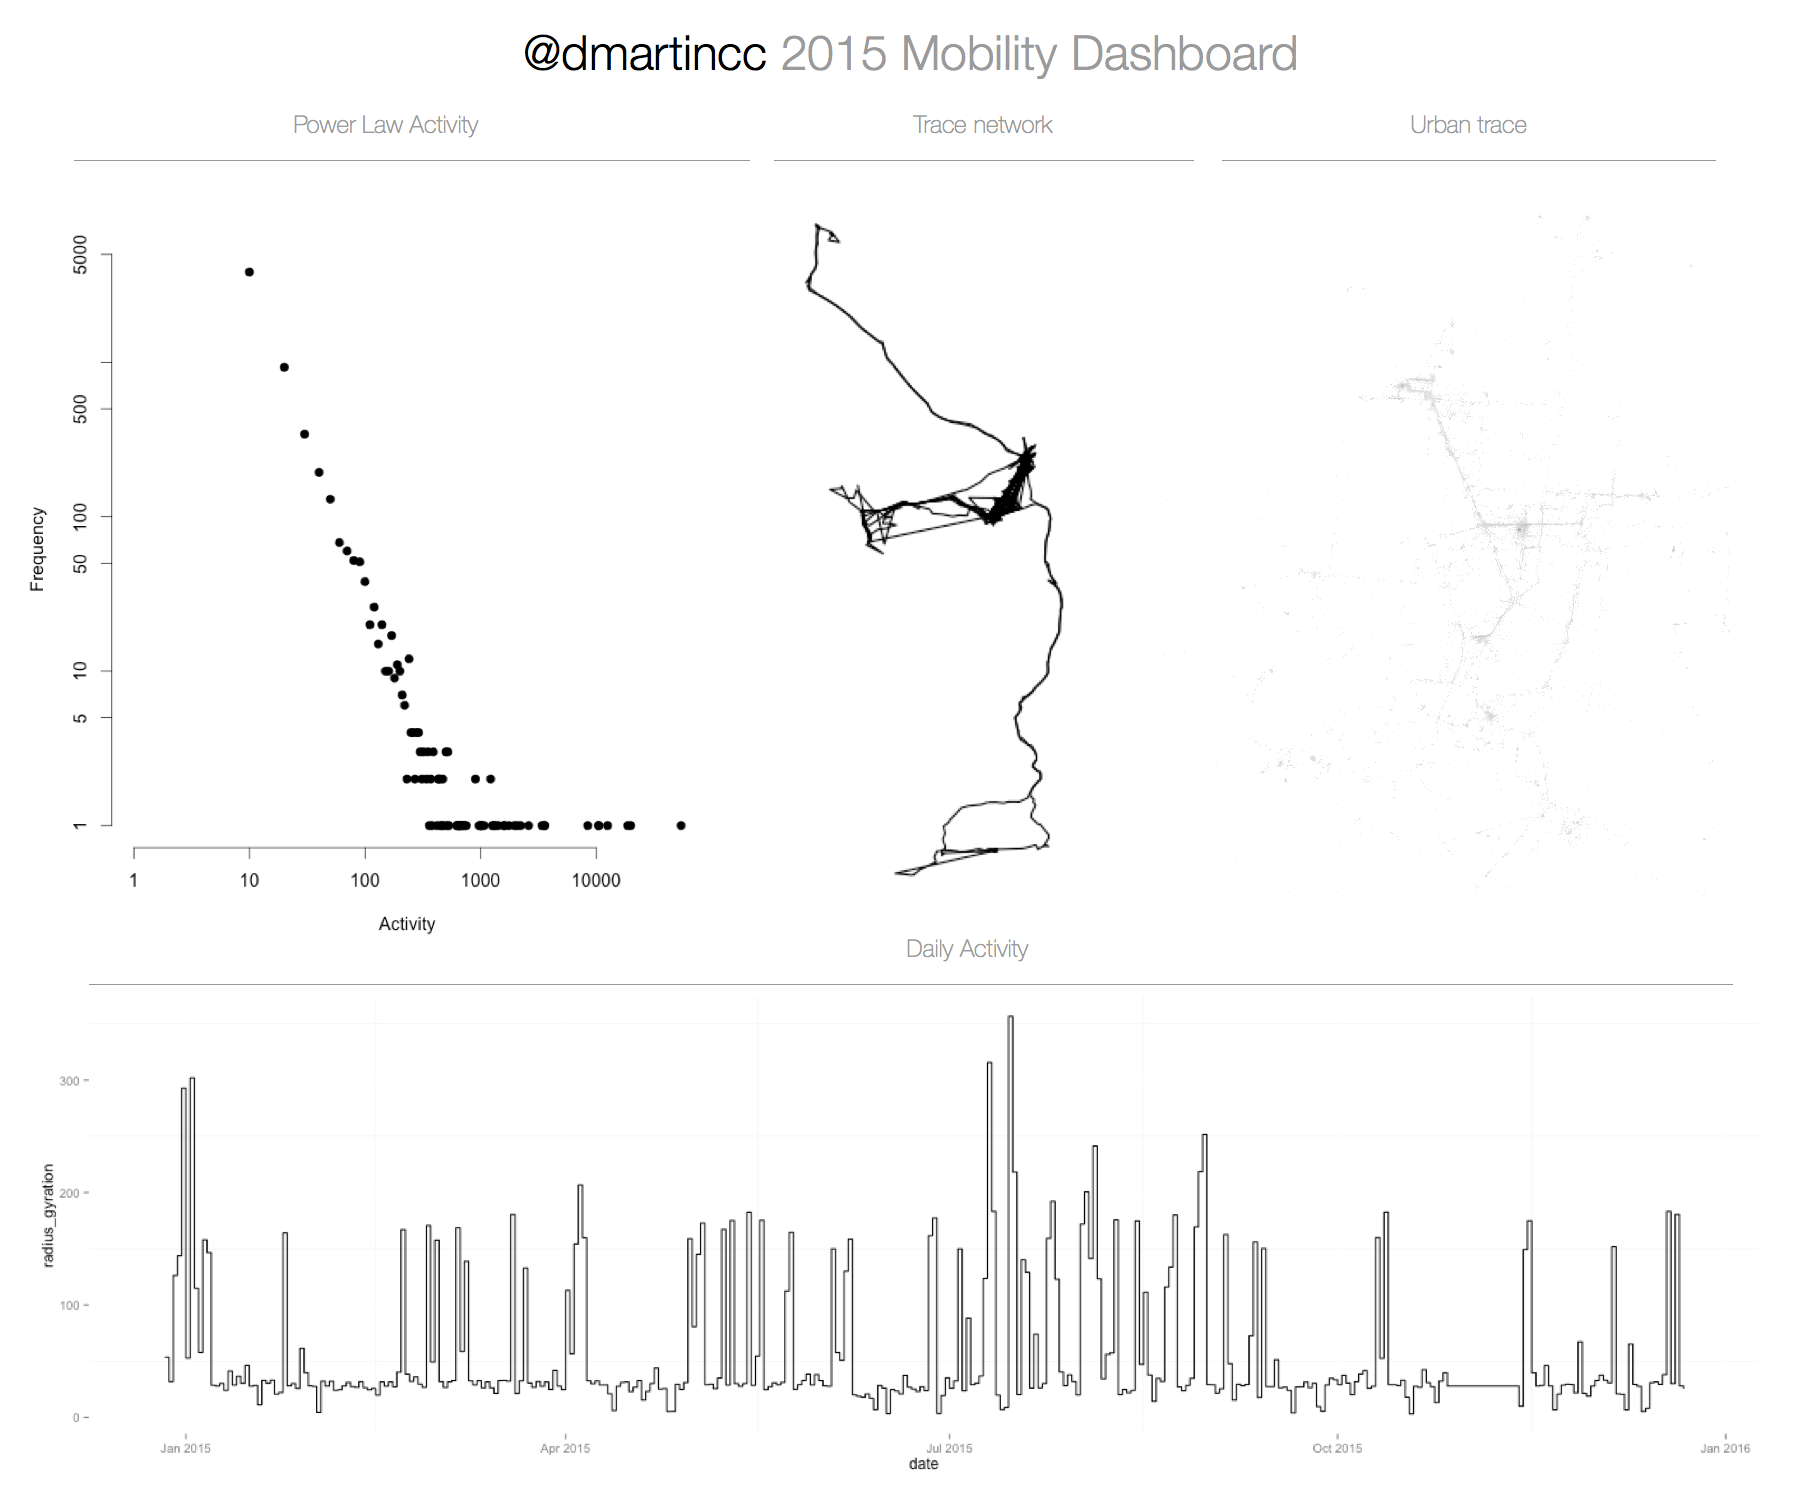
All the data was collected with a Flask application which has granted access to my Google fit data.
References:
-
Mi historia de emprendimiento. Lo que tú llamas fracaso, yo lo llamo crecimiento.
Mis vivencias como emprendedor. Leer Más
-
📈 How to setup a product growth process from scratch for your startup
It’s now three months since we launched Zensei, Cherni and me, after some changes in our lives we made the decision to bet on this business idea, which has... Leer Más
-
2022 Expansión interna para levantarme y volver a emprender
Historia de crecimiento personal de un emprendedor Leer Más