By David Martín-Corral, Manuel Cebrian & Esteban Moro.
This post was originally posted at Smartvel blog.
One of the future predictions of humanity is that travel will be one of the main activities due to the technology advances that will free us from labour work, converting cities in theme parks. The capacity of those cities to attract tourist will come from their singularity, information and experiences they can offer to future tourists.
🔖 Navega el contenido
“The first requisite to happiness is that a man must be born in a famous city” Eurípides
On the other hand, according to the United Nations 54% of the global population lives in urban areas and it is predicted to increase to 66% by 2050 [1]. This first statement tell us about the ubiquity of cities and how they are great centers of mass, developing hubs of knowledge and know how scattered around the globe. These hubs of information are drivers of development and progress for the individuals who live in [2].
With the current blast of information, it is frequent to listen conversations comparing cities between each other in terms of, which one is best to have pizza, which one is the best to go clubbing, which one is the best to visit museums and so on. It is in human nature to extract knowledge and share it from their experiences when they travel. However, does anyone know which is the best city in terms of social events productivity and which is the best one to travel according to individuals interests?
At Smartvel, we mainly work with social events data, which can be concerts, theaters, conferences, art exhibitions, sport events and so on, in order to help travellers to be better informed. We thought that cities’ populations could be a proxy for predicting the production of events and the spreading of information in urban areas. In the scientific literature, it has already been discovered that cities sizes are predictors of population-level variables such as productive and patenting activity, crime, contagious diseases rates [3], electric cable length or personal income [2]. Data consists of events aggregated by city for over a year, from September 2014 to August 2015.
Scaling and power laws
Power laws distributions are everywhere in nature [4], but what is a power law? It is just when you have two variables and one varies as a power of another. All the population-level variables, that we have seen above, fall under power law functions of population size with exponents that scale with super-linearity.
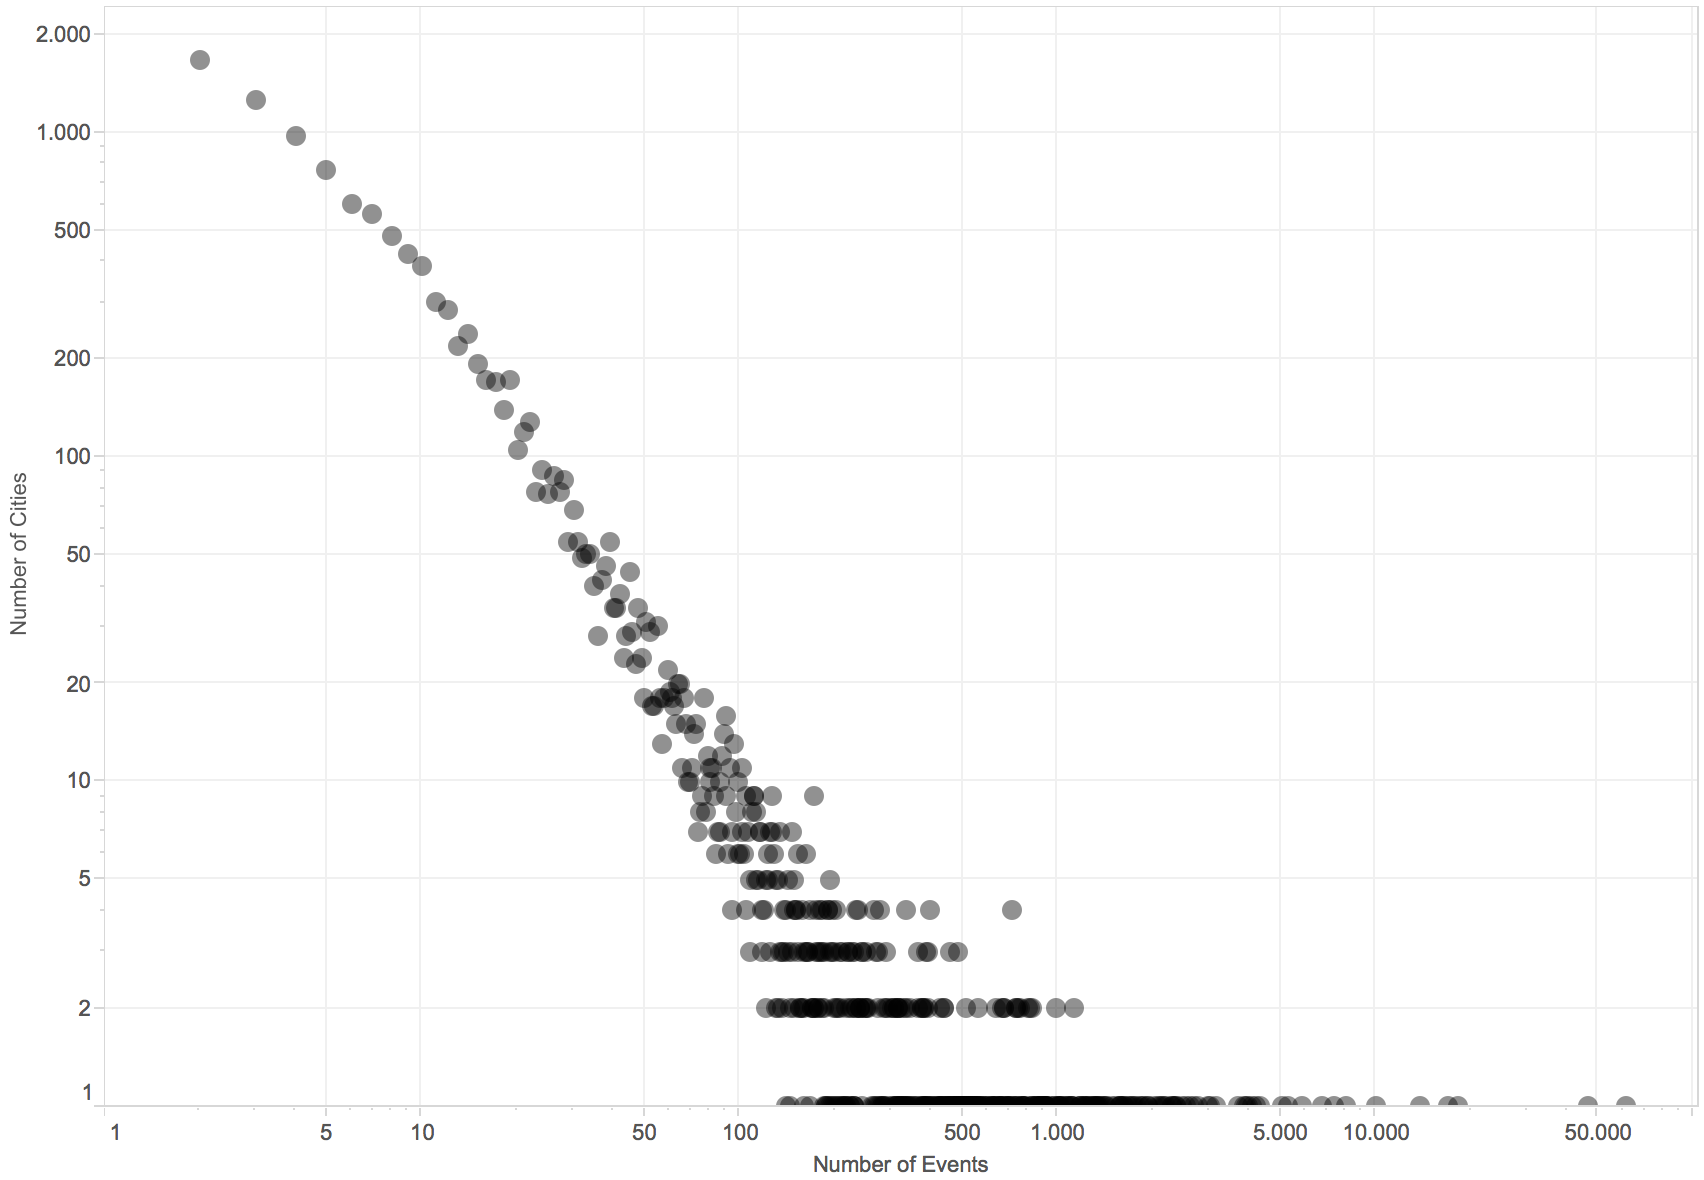 Figure 1: City events power law distribution
In figure 1, it can been seen that the number of events in cities follows a power law. When looking at the number of events against populations, figure 2, a pattern emerge and it can be appreciated a super-linearity effect, when scaling population sizes. However, there is some biased for big cities with a small number of events for their populations. This can be due to two reasons. One, we have not entered that market yet, therefore it has not been put focus on collecting events for those cities, or two, those cities do not have enough mass centre in order to generate social events.
Findings
In order to see how the number of events scales super-linearly more clearly, it has been plotted each city with its total relevance, figure 3. At Smartvel, there is a relevance system that uses collaborative intelligence in order to score events, ranging from places relevances, performers relevances and categories relevances, this system enables us to rank events according to their importance. In figure 2, it clearly appears a super linear increase in the number of events. Another detail to pay attention, it is that when a city has more than 200 events over a year the capacity of production for those cities increase exponentially.
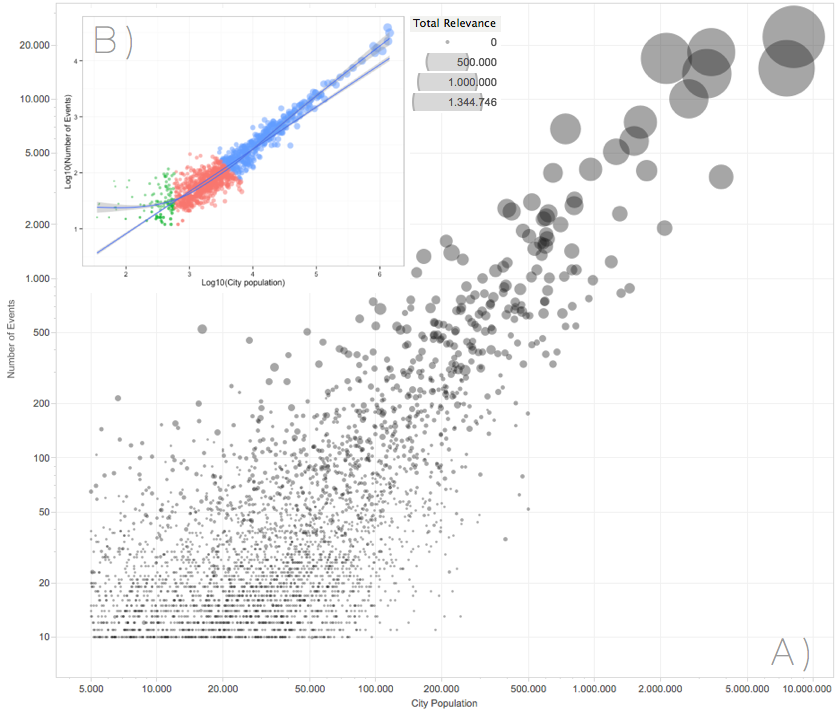
Figure 2: Cities’ number of events correlated with their populations, there is a super-linear pattern. Data has been filtered by cities countries (USA, France, Portugal, UK and Spain) A. Number of events by city correlated with populations and total relevance. B. Two fitted regression models, one with linear regression model and a second one with two degree of freedom for capturing exponential scaling of big populations. Also a clustering algorithm has been applied for detecting different group of cities.
After all the data analysis, we thought that some predictive models could be developed in order to know the number of events of a certain city. These models, operationally, gives us a lot of insight, because it will ensure that over a period of one year there is feasible number of events.
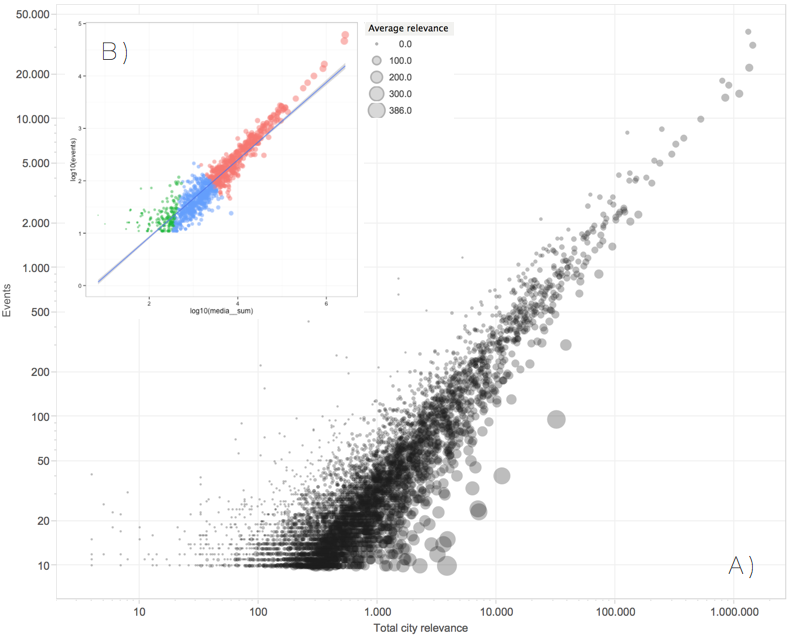
Figure 3: A. Cities’ relevances against number of events, which also follows an exponential increase, size of cities is defined by average relevance, in order to find cities worth to visit. B. A linear fitted model coloured by the clustering algorithm applied
Consequently, it can be obvious that big cities are more productive when sharing information across social events. However, which are the cities that have events worthy to attend? In figure 3, those cities show up, which are small but have very relevant events and are worthy to attend.
When looking at certain countries’ cities separately the same pattern emerges, where big cities are on the right hand side of the charts, and small and with high social activity are above the trend line. Figure 4 gives a much clearer image of where the production of events it is above average. Big and high dynamic cities.
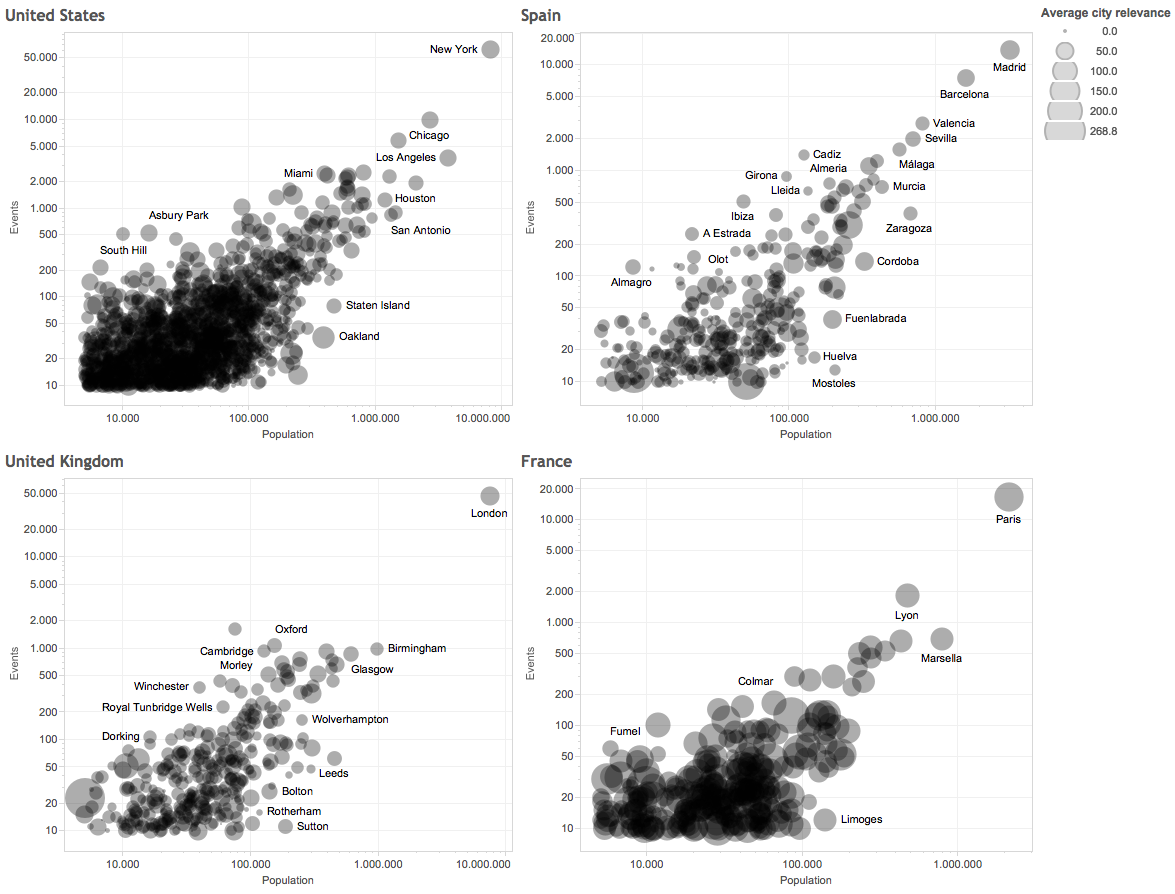
Figure 4: Cities events correlated with populations for United States, Spain, United Kingdom and France, where cities sizes is defined by average relevance.
Cities profiling
Cities are life living organisms, behaving differently despite of being in a same country or geopolitical area. Therefore the productivity of one city to produce different kind of events depend on multiple factors, which make the essence of cities, such as universities, museums, local communities, music and art scenes, and so on. This means that two cities from a same country are totally different in terms of their city souls. In figure 5 we present the most important cities in their capacities to be hubs of events creation and how differ in their productions between each other. It can be seen that there is a set of categories that are common across all cities, such as music, football, theater, culture *and museums* that vary all of them together from 65% in San Francisco to up to 95% in London. However, their productions differ depending on the cities characteristics.
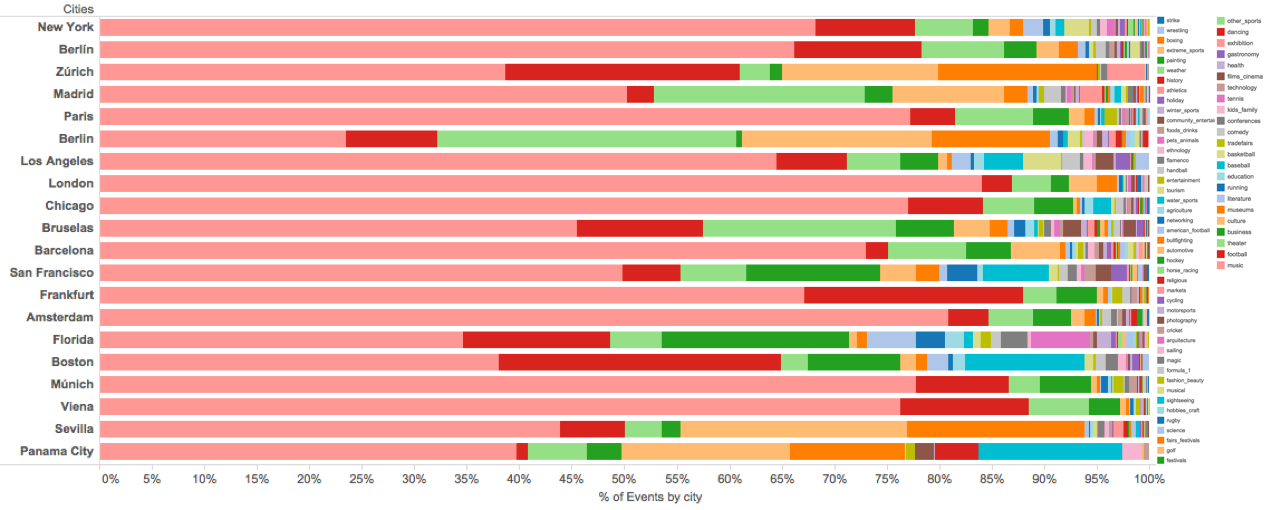
Figure 5: Cities production distribution of events by category
One question that arises when studying cities and their events categories distributions, it is to know how diverse are in the generation of events. In order to calculate diversity, it was used the Shannon entropy [5], also known in ecology by the Shannon diversity index [6], that reflects the different number of types that are in dataset, in this case, events categories. Over the Shannon index it has been calculated the Pielou’s evenness index [7], which is constrained between 0 and 1. The less variation in communities between the species, the higher the evenness index is.
In figure 6, it can be seen that there is a clear correlation between population and categories variability, this might imply that bigger cities have more specialisation or selection of the information, where in small cities every event can show up in every channel of propagation, however, in big cities events cannibalised between each other for being in online events platforms.
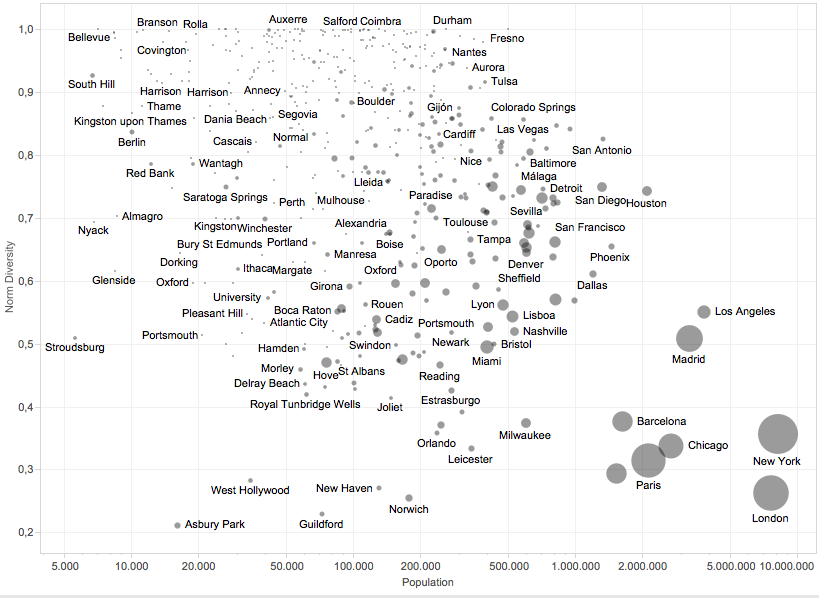
Figure 6: Cities normalised diversities against population for France, Portugal, Spain, United States and United Kingdom.
We wanted to go further and test if web searchers (or number of visitors) super-scale with their populations [8], in this case we have used Wikipedia page views, which are provided by the service http://stats.grok.se/. In figure 7, it can be seen that cities populations are super-linear against Wikipedia page views, with an exponent equal to 1.1, which is higher than one, implying super-linearity. However, there is some variability depending on social-media factors, that can generate some noise in our measurements.
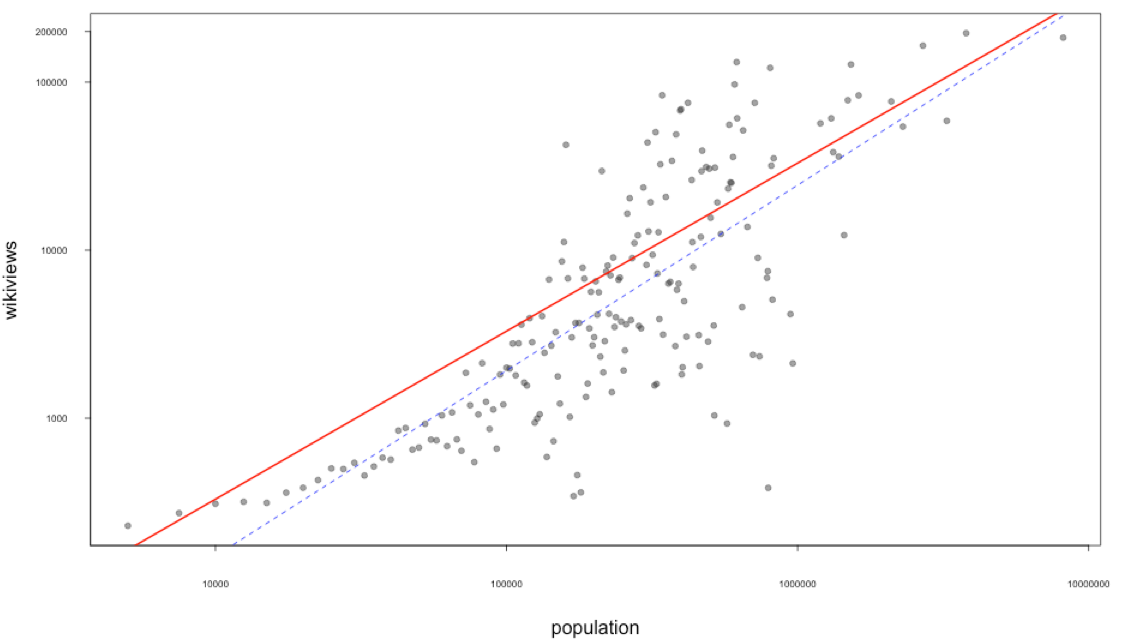 Figure 7: Cities populations groups and Wikipedia pageviews medians for the last 90 days. Red line is fitted model without log-log, and the blue dashed line is the log-log fitted model, which shows super-linearity.
The distribution of events varies geographically, having big cities in developed countries higher proportion of events by citizen, this can be appreciated in figure 8, where countries are represented by their events populations proportions. In addition, North America and Europe are great geo-political areas for events production.
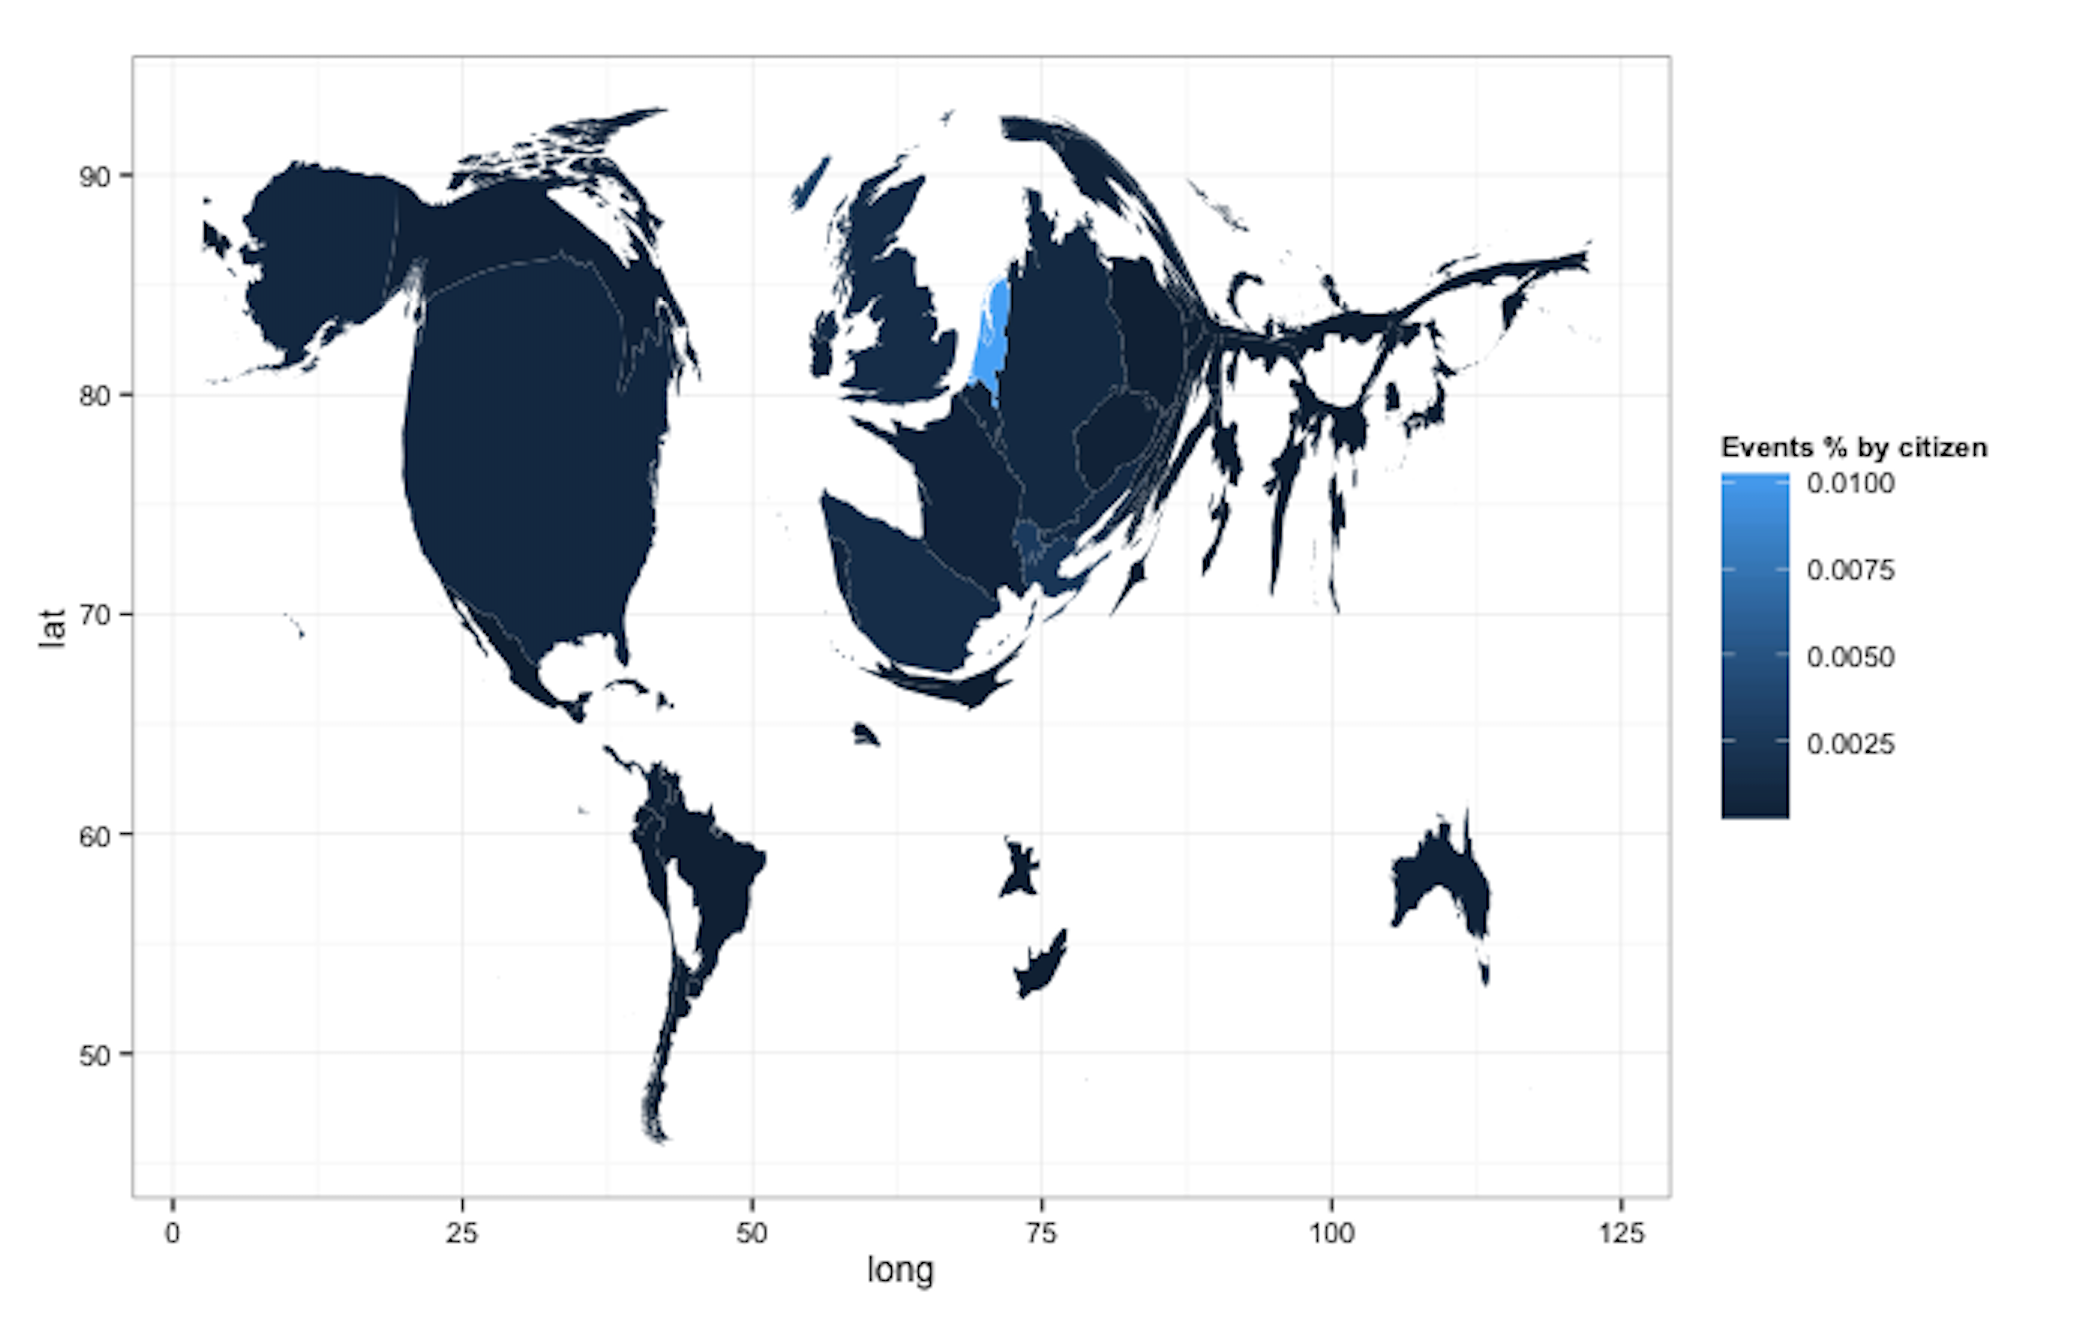 Figure 8: Cartogram of countries by normalised number of events by countries populations.
Where to travel?
When individuals travel to visit a city have different motives, ones travel to discover the city, others to attend a conference, a concert, to run a marathon, etc. Therefore, there are many reasons on the actions of visiting cities. In case you just want to discover a city and know what you can do or you have a passion about some topic. This next lines may help you.
If you love music, Hamburg is your city, up to 90% of their events are music related, follow by London with 83%. But what happen if you don´t miss a museum and their expositions, Sevilla (17%), Zurich (15%) and Berlin (11%) are those with higher number of museums related events. Are you a foodie?, Los Angeles, San Francisco and Miami are great cities for finding gastronomy events for delighting your palate. However, for those that run marathons around the world, San Francisco (2%), Brussels (1%) and Lisbon (1%) have a great running scenes. These is an example of how cities differ in their social events productions and how they range based on the topic.
According to figure 7, if you like to have a diverse offer of events, maybe you should travel to cities like London, New York, Chicago, Paris, Madrid or Barcelona, where you will not get bored.
Conclusions
To sum up, the production of events at cities follow a power law, where population can be used as predictor variable. Firstly, big cities according to the power law distribution are bigger hubs for generating and sharing information in the form of social events, having more dynamic scenes. Secondly, urban areas with high populations sizes does not imply diversity indexes which are top ranked among all cities. Finally, cities are characterised by several factors, such as population, geography, economic diversity, weather and so on, which shape the capacity of generating geographic hubs of information.
References
-
United Nations — World’s population increasingly urban with more than half living in urban areas (2014)
-
Luís M. A. Bettencourt, José Lobo, Dirk Helbing, Christian Kühnert, and Geoffrey — Growth, innovation, scaling, and the pace of life in cities.
-
Wei Pan, Gourab Ghoshal, Coco Krumme, Manuel Cebrian, and Alex Pentland — Urban characteristics attributable to density-driven tie formation.
-
M. E. J. Newman — Power laws, Pareto distributions and Zipf’s law
-
Shannon, C. E. and Weaver W. (1948) A mathematical theory of communication. The Bell System Technical Journal, 27, 379–423 and 623–656.
-
Hill, M. O. (1973). “Diversity and evenness: a unifying notation and its consequences”. Ecology 54: 427–432
-
Mulder, C. P. H.; Bazeley-White, E.; Dimitrakopoulos, P. G.; Hector, A.; Scherer-Lorenzen, M.; Schmid, B. (2004). “Species evenness and productivity in experimental plant communities”
-
M. Lenormand, B. Gonçalves, A. Tugores and J. Ramasco (2015). “Human diffusion and city influence”
-
Cómo un epidemiólogo no convencional consigue aportar su granito de arena a una solución para los rebrotes del COVID-19
Historia sobre como ha vivido un epidemiólogo digital el confinamiento y publica en Nature una solución para los rebrotes del COVID-19- Leer Más
-
📈 How to setup a product growth process from scratch for your startup
It’s now three months since we launched Zensei, Cherni and me, after some changes in our lives we made the decision to bet on this business idea, which has... Leer Más
-
2022 Expansión interna para levantarme y volver a emprender
Historia de crecimiento personal de un emprendedor Leer Más